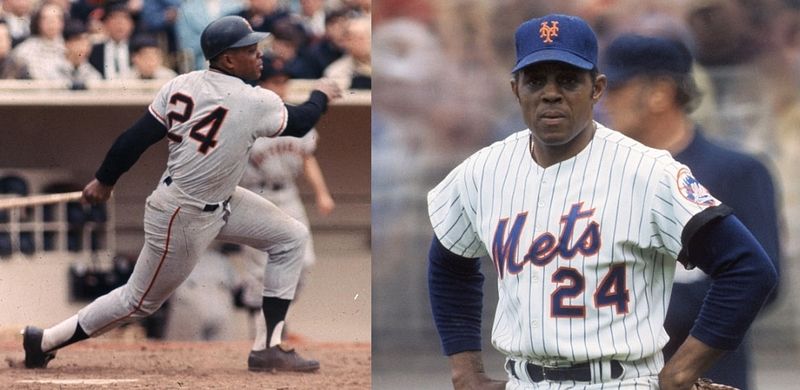
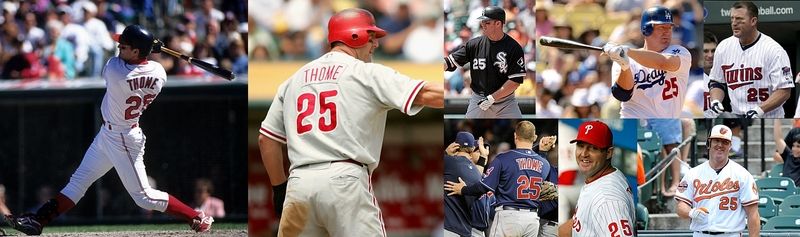
It's time for another installment of Ultimate Number Players! In case you've forgotten how this works, the Ultimate Number Player has to have worn a particular uniform number with every stint with every franchise he played for, and he must be (in my judgment) the best player to have played with the most franchises wearing that number. We've done them all from 1 to 20, so now we'll do another block of five.
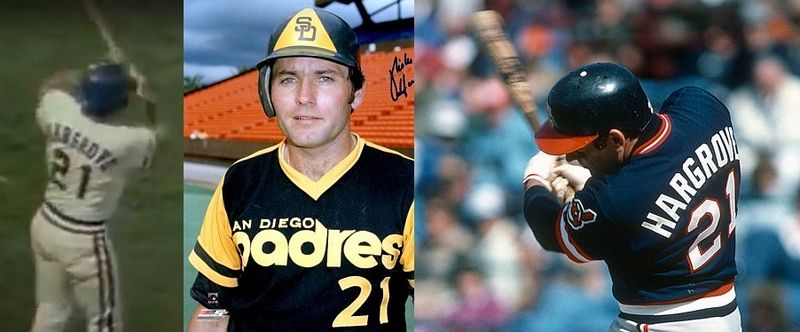
Ultimate #21: Warren Spahn
It's hard to find a good photo of Spahn in a Giants uniform with his #21 visible. The closest thing I've found is grainy black-and-white footage from the infamous Marichal-Roseboro brawl where the back of his jersey can be seen among the chaos. For the photo collage, I chose the only other qualifying player with three franchises: Mike Hargrove. I know this looks terrible compared to some of the others I've made, but it was the best I could do.
Ultimate #22: Walt Weiss
Thank goodness he wore #22 for one season with the Athletics before embarking on his journey around the majors.
Ultimate #23: Ted Simmons
Several 23s had three franchises, but Simmons was by far the best of the lot.
Ultimate #24: Willie Mays
24 proved to be a difficult number to keep one's entire career, but the greatest player ever to wear it takes the prize here with his two franchises.
Ultimate #25: Jim Thome
I don't know how he did it, but Thome bounced around a ton, somehow always holding on to the coveted #25. This collage is a thing of beauty in my eyes.
Tuesday, August 28, 2018
Tuesday, July 31, 2018
Half the Guys Are Gone
For today's post, I''m just going to share some data I've compiled and you can make of it what you will.
At what point are half the players on a team deceased? If the total number of players (let's call it variable n) is odd, it'd be when the number of deceased players is equal to (n + 1 / 2). If you have an even number of players, it's when the number of deceased players is (n / 2). I looked at the years that were multiples of ten between 1910 and 1960 to see which players marked the halfway point of the players being deceased for each of them, and also how long it took to occur. For a couple from 1960, they didn't even reach that level till earlier this year. I also looked at how it compared to the average age of the team to see how strong the correlation was.
r = -0.18
r = -0.06
r = -0.35
r = -0.31
r = -0.19
r = -0.05
The r variable, for anyone unaware, shows the strength of correlation. A negative number, as we see in each of these cases, shows that the higher the number of years until a team reaches the halfway point, the younger the average age of the team is. That's consistent with what we'd expect, but as we can see, the correlation isn't particularly strong in any of these cases. There's no higher than a 35% correlation in any instance, and in some cases it's close to zero.
I'm also not sure why from 1920 to 1930 the average number of years till a team reached the halfway point actually dropped. You'd think we'd see a steady rise, considering the increases in life expectancy over time.
I suppose I'll have to compile the data for more years than just these, to see if we can spot any trends, because six different years isn't exactly the largest sample size. We'll see what comes of that. To be continued? Maybe?
At what point are half the players on a team deceased? If the total number of players (let's call it variable n) is odd, it'd be when the number of deceased players is equal to (n + 1 / 2). If you have an even number of players, it's when the number of deceased players is (n / 2). I looked at the years that were multiples of ten between 1910 and 1960 to see which players marked the halfway point of the players being deceased for each of them, and also how long it took to occur. For a couple from 1960, they didn't even reach that level till earlier this year. I also looked at how it compared to the average age of the team to see how strong the correlation was.
| 1910 | Name | Death Date | Years | Avg Age |
|---|---|---|---|---|
| Pittsburg | Howie Camnitz | 3/2/1960 | 50 | 28.3 |
| Philadelphia (AL) | Jack Coombs | 4/15/1957 | 47 | 27.6 |
| Cincinnati | Frank Roth | 3/27/1955 | 45 | 26.2 |
| Cleveland | Heinie Berger | 2/10/1954 | 44 | 28.2 |
| Boston (AL) | Bunny Madden | 1/20/1954 | 44 | 25.5 |
| Chicago (AL) | Fred Payne | 1/16/1954 | 44 | 27.1 |
| Brooklyn | Rube Dessau | 5/6/1952 | 42 | 25.9 |
| New York (NL) | Doc Crandall | 8/17/1951 | 41 | 25.7 |
| Washington | Doc Ralston | 8/29/1950 | 40 | 27.9 |
| Boston (NL) | Jim Riley | 3/25/1949 | 39 | 26.5 |
| Detroit | Marv Peasley | 12/27/1948 | 38 | 27.8 |
| New York (AL) | Walter Blair | 8/20/1948 | 38 | 27.4 |
| St. Louis (NL) | Rebel Oakes | 3/1/1948 | 38 | 26.4 |
| Chicago (NL) | Mordecai Brown | 2/14/1948 | 38 | 29.0 |
| St. Louis (AL) | Hub Northen | 10/1/1947 | 37 | 28.2 |
| Philadelphia (NL) | Kitty Bransfield | 5/1/1947 | 37 | 29.0 |
| MLB AVG | 41.4 | 27.3 |
r = -0.18
| 1920 | Name | Death Date | Years | Avg Age |
|---|---|---|---|---|
| Pittsburgh | Billy Southworth | 11/15/1969 | 49 | 27.6 |
| Philadelphia (AL) | Chick Galloway | 11/7/1969 | 49 | 24.7 |
| New York (AL) | Rip Collins | 5/27/1968 | 48 | 27.8 |
| Cleveland | Ray Caldwell | 8/17/1967 | 47 | 29.3 |
| Brooklyn | Doug Baird | 6/13/1967 | 47 | 30.1 |
| Chicago (NL) | Hippo Vaughn | 5/29/1966 | 46 | 29.3 |
| Philadelphia (NL) | Gene Paulette | 2/8/1966 | 46 | 28.9 |
| Washington | Bill Hollahan | 11/27/1965 | 45 | 27.2 |
| Cincinnati | Jimmy Ring | 7/6/1965 | 45 | 29.1 |
| Boston (AL) | Wally Schang | 3/6/1965 | 45 | 28.1 |
| Detroit | Oscar Stanage | 11/11/1964 | 44 | 28.9 |
| St. Louis (AL) | Roy Sanders | 7/8/1963 | 43 | 28.5 |
| Chicago (AL) | Dickey Kerr | 5/4/1963 | 43 | 29.4 |
| Boston (NL) | Ray Powell | 10/16/1962 | 42 | 27.9 |
| St. Louis (NL) | Burt Shotton | 7/29/1962 | 42 | 26.4 |
| New York (NL) | Frank Snyder | 1/5/1962 | 42 | 26.9 |
| MLB AVG | 45.2 | 28.1 |
r = -0.06
| 1930 | Name | Death Date | Years | Avg Age |
|---|---|---|---|---|
| New York (NL) | Hughie Critz | 1/10/1980 | 50 | 27.2 |
| Cleveland | Milt Shoffner | 1/19/1978 | 48 | 27.3 |
| Boston (NL) | Lance Richbourg | 9/10/1975 | 45 | 29.6 |
| Cincinnati | Marty Callaghan | 6/23/1975 | 45 | 29.6 |
| New York (AL) | Ownie Carroll | 6/8/1975 | 45 | 27.0 |
| Detroit | Jimmy Shevlin | 10/30/1974 | 44 | 26.7 |
| Pittsburgh | Steve Swetonic | 4/22/1974 | 44 | 26.7 |
| Chicago (AL) | Bennie Tate | 10/27/1973 | 43 | 27.4 |
| St. Louis (NL) | Frankie Frisch | 3/12/1973 | 43 | 29.6 |
| Chicago (NL) | Danny Taylor | 10/11/1972 | 42 | 29.4 |
| Boston (AL) | Charlie Berry | 9/6/1972 | 42 | 28.6 |
| St. Louis (AL) | General Crowder | 4/3/1972 | 42 | 28.7 |
| Brooklyn | Ray Phelps | 7/7/1971 | 41 | 28.9 |
| Philadelphia (NL) | Tripp Sigman | 3/8/1971 | 41 | 27.1 |
| Washington | Bobby Burke | 2/8/1971 | 41 | 29.1 |
| Philadelphia (AL) | Pinky Higgins | 3/21/1969 | 39 | 28.7 |
| MLB AVG | 43.4 | 28.2 |
r = -0.35
| 1940 | Name | Death Date | Years | Avg Age |
|---|---|---|---|---|
| Boston (NL) | Hank Majeski | 8/9/1991 | 51 | 26.3 |
| Philadelphia (AL) | Wally Moses | 10/10/1990 | 50 | 26.9 |
| New York (NL) | Mickey Witek | 8/24/1990 | 50 | 28.7 |
| Philadelphia (NL) | Neb Stewart | 6/8/1990 | 50 | 27.4 |
| St. Louis (NL) | Creepy Crespi | 3/1/1990 | 50 | 27.1 |
| New York (AL) | Lefty Gomez | 2/17/1989 | 49 | 28.1 |
| Chicago (NL) | Zeke Bonura | 3/9/1987 | 47 | 28.9 |
| Cincinnati | Vince DiMaggio | 10/3/1986 | 46 | 28.8 |
| Detroit | Hank Greenberg | 9/4/1986 | 46 | 29.4 |
| St. Louis (AL) | George Susce | 2/25/1986 | 46 | 28.2 |
| Washington | Sam West | 11/23/1985 | 45 | 26.8 |
| Boston (AL) | Joe Glenn | 5/6/1985 | 45 | 28.1 |
| Cleveland | Hank Helf | 10/27/1984 | 44 | 26.7 |
| Brooklyn | Gus Mancuso | 10/26/1984 | 44 | 28.4 |
| Chicago (AL) | Joe Kuhel | 2/26/1984 | 44 | 29.4 |
| Pittsburgh | Ed Leip | 11/24/1983 | 43 | 27.6 |
| MLB AVG | 46.9 | 27.9 |
r = -0.31
| 1950 | Name | Death Date | Years | Avg Age |
|---|---|---|---|---|
| Washington | Sandy Consuegra | 11/16/2005 | 55 | 28.6 |
| St. Louis (AL) | Ribs Raney | 7/7/2003 | 53 | 25.5 |
| New York (AL) | Joe Ostrowski | 1/3/2003 | 53 | 29.2 |
| Chicago (NL) | Harry Chiti | 1/31/2002 | 52 | 27.5 |
| Boston (AL) | Bob Gillespie | 11/4/2001 | 51 | 29.8 |
| New York (NL) | Bill Rigney | 2/20/2001 | 51 | 27.0 |
| St. Louis (NL) | Tom Poholsky | 1/6/2001 | 51 | 29.1 |
| Boston (NL) | Willard Marshall | 11/5/2000 | 50 | 29.2 |
| Chicago (AL) | John Perkovich | 9/16/2000 | 50 | 28.4 |
| Philadelphia (NL) | Ken Heintzelman | 8/14/2000 | 50 | 26.5 |
| Brooklyn | Pee Wee Reese | 8/14/1999 | 49 | 27.5 |
| Cleveland | Early Wynn | 4/4/1999 | 49 | 29.2 |
| Philadelphia (AL) | Ben Guintini | 12/2/1998 | 48 | 31.2 |
| Detroit | Hal Newhouser | 11/10/1998 | 48 | 28.2 |
| Pittsburgh | Stan Rojek | 7/9/1997 | 47 | 28.6 |
| Cincinnati | Bobby Adams | 2/13/1997 | 47 | 27.5 |
| MLB AVG | 50.3 | 28.3 |
r = -0.19
| 1960 | Name | Death Date | Years | Avg Age |
|---|---|---|---|---|
| Cleveland | Tito Francona | 2/13/2018 | 58 | 28.2 |
| Los Angeles | Wally Moon | 2/9/2018 | 58 | 27.7 |
| Detroit | Chico Fernandez | 6/11/2016 | 56 | 28.6 |
| San Francisco | Jim Davenport | 2/18/2016 | 56 | 26.8 |
| Kansas City | Ken Johnson | 11/21/2015 | 55 | 28.3 |
| St. Louis | Ray Sadecki | 11/17/2014 | 54 | 28.6 |
| Philadelphia | Al Dark | 11/13/2014 | 54 | 26.1 |
| Chicago (AL) | Gene Freese | 6/19/2013 | 53 | 30.8 |
| Milwaukee | Stan Lopata | 6/15/2013 | 53 | 30.0 |
| Boston | Tom Borland | 3/2/2013 | 53 | 29.0 |
| Chicago (NL) | Ed Bouchee | 1/23/2013 | 53 | 28.1 |
| Washington | Don Mincher | 3/4/2012 | 52 | 27.4 |
| New York | Andy Carey | 12/15/2011 | 51 | 28.1 |
| Pittsburgh | Gino Cimoli | 2/12/2011 | 51 | 28.6 |
| Baltimore | Al Pilarcik | 9/20/2010 | 50 | 27.8 |
| Cincinnati | Whitey Lockman | 3/17/2009 | 49 | 27.3 |
| MLB AVG | 53.5 | 28.2 |
r = -0.05
The r variable, for anyone unaware, shows the strength of correlation. A negative number, as we see in each of these cases, shows that the higher the number of years until a team reaches the halfway point, the younger the average age of the team is. That's consistent with what we'd expect, but as we can see, the correlation isn't particularly strong in any of these cases. There's no higher than a 35% correlation in any instance, and in some cases it's close to zero.
I'm also not sure why from 1920 to 1930 the average number of years till a team reached the halfway point actually dropped. You'd think we'd see a steady rise, considering the increases in life expectancy over time.
I suppose I'll have to compile the data for more years than just these, to see if we can spot any trends, because six different years isn't exactly the largest sample size. We'll see what comes of that. To be continued? Maybe?
Labels:
deaths,
lists,
statistical studies
Friday, June 29, 2018
Missed It By That Much
My earlier post about "Interregnum Players" has an interesting variant: Players whose stints with a team include the years before and after a championship, but not the championship years themselves. This happens more often than you might realize, and who has the full list? Baseball Junk Drawer, of course!
Here are the guys who were there on the way up and the way down, but not at the pinnacle. In addition to having played for the franchise in the years bookending a World Series championship, I also made the requirement that they may not have won a World Series with the franchise in question in a different year, though winning one with a different club is acceptable. That's why you'll see a World Series MVP on this list, but no Adam Wainwright.
Nick Noonan and Zac Rosscup are still active, so it's theoretically possible that they could win a World Series with their respective franchises. I didn't look into the 2017 Astros, since you really can't determine whether someone belongs on this list until a team is no longer defending its title.
The only other asterisked player is Dixie Walker, who missed out on the 1932 Yankees' season. I put him on this list despite the fact that he briefly played with the 1936 champions, because they got rid of him early in the season, and I doubt he got a share of the World Series money.
It's true that some of these guys were in the dugout when their teams won, either as coaches or injured players, but not getting to participate in any game itself during the season has to sting just a little.
Here are the guys who were there on the way up and the way down, but not at the pinnacle. In addition to having played for the franchise in the years bookending a World Series championship, I also made the requirement that they may not have won a World Series with the franchise in question in a different year, though winning one with a different club is acceptable. That's why you'll see a World Series MVP on this list, but no Adam Wainwright.
| Name | Years With Team |
|---|---|
| Doc Marshall | 1904, 1906 NYG |
| Walt Tragesser | 1913, 1915-19 BSN |
| Walter Mueller | 1922-24, 1926 PIT |
| George Puccinelli | 1930, 1932 STL |
| Dixie Walker* | 1931, 1933-36 NYY |
| Charlie Wilson | 1932-33, 1935 STL |
| Red Phillips | 1934, 1936 DET |
| Mike Chartak | 1940, 1942 NYY |
| Ed Levy | 1942, 1944 NYY |
| Rufe Gentry | 1943-44, 1946-48 DET |
| Johnny Gorsica | 1940-44, 1946-47 DET |
| Pinky Higgins | 1939-44, 1946 DET |
| Dick Wakefield | 1941, 1943-44, 1946-49 DET |
| Bud Souchock | 1946, 1948 NYY |
| Bob Darnell | 1954, 1956 BRO |
| Dick Williams | 1951-54, 1956 BRO |
| Humberto Robinson | 1955-56, 1958 MLN |
| Bob Roselli | 1955-56, 1958 MLN |
| Al Jackson | 1959, 1961 PIT |
| Joe Moeller | 1962, 1964, 1966-71 LAD |
| Bart Shirley | 1964, 1966, 1968 LAD |
| Mike Jorgensen | 1968, 1970-71, 1980-83 NYM |
| Gene Garber | 1969-70, 1972 PIT |
| Ray Knight | 1974, 1977-81 CIN |
| Oscar Gamble | 1976, 1979-84 NYY |
| Joe Beckwith | 1979-80, 1982-83, 1986 LAD |
| Manny Mota | 1969-80, 1982 LAD |
| Floyd Rayford | 1980, 1982, 1984-87 BAL |
| Clint Hurdle | 1983, 1985, 1987 NYM |
| Mariano Duncan | 1985-87, 1989 LAD |
| Mike Bielecki | 1991-92, 1994, 1996-97 ATL |
| Terry Pendleton | 1991-94, 1996 ATL |
| Mike Stanley | 1992-95, 1997 NYY |
| Chris Hammond | 1993-96, 1998 FLA |
| Andy Larkin | 1996, 1998 FLA |
| Matt Mantei | 1995-96, 1998-99 FLA |
| Danny Klassen | 1998-2000, 2002 ARI |
| Todd Stottlemyre | 1999-2000, 2002 ARI |
| Bart Miadich | 2001, 2003 ANA |
| Abraham Nunez | 2002, 2004 FLA |
| Sandy Alomar | 2001-04, 2006 CHW |
| Craig Hansen | 2005-06, 2008 BOS |
| David Pauley | 2006, 2008 BOS |
| Chad Moeller | 2008, 2010 NYY |
| Bryan Anderson | 2010, 2012 STL |
| Steven Hill | 2010, 2012 STL |
| Eric Surkamp | 2011, 2013 SFG |
| Nick Noonan* | 2013, 2015 SFG |
| Zac Rosscup* | 2013-15, 2017 CHC |
Nick Noonan and Zac Rosscup are still active, so it's theoretically possible that they could win a World Series with their respective franchises. I didn't look into the 2017 Astros, since you really can't determine whether someone belongs on this list until a team is no longer defending its title.
The only other asterisked player is Dixie Walker, who missed out on the 1932 Yankees' season. I put him on this list despite the fact that he briefly played with the 1936 champions, because they got rid of him early in the season, and I doubt he got a share of the World Series money.
It's true that some of these guys were in the dugout when their teams won, either as coaches or injured players, but not getting to participate in any game itself during the season has to sting just a little.
Labels:
lists
Tuesday, May 29, 2018
The Pythagorean Pennant
The game isn't played on paper. This we all know. But that doesn't stop us from asking whether the results we see were the ones we should have expected.
One concept that has gained popularity over the years in advanced sports analysis is the concept of Pythagorean Won-Lost Record. For those unfamiliar, Pythagorean Won-Lost Record uses a formula to determine the number of wins and losses a team should be expected to have based on the number of runs scored versus runs allowed. Few teams play precisely to their Pythagorean expectations, but most fall within three games of it. There are always, however, teams that wildly exceed or fall short of their expectations, and in a pennant race, those games can be the difference between a trip to the World Series and an early winter break.
Before the divisional play era, only one team from each league made it to the postseason. Based on Pythagorean W-L, how often did we see the World Series matchup that should've been expected? The chart below shows who won the Pythagorean pennant each year during that era. Teams marked with red are different than the actual winners, and boxes marked with blue are ones where tiebreakers would've had to be played to determine the winner.
It's heartening to see that most years the "correct" team wins.There are some long stretches here of black ink.
It's interesting to note that based on this data, several historical teams could be considered overrated or underrated. Connie Mack's Athletics from the "$100,000 Infield" era should've won five of six pennants, rather than the mere four of five they actually won. Their American League successors should've been the Chicago White Sox, if only they hadn't underperformed. The Red Sox of that era would've been the exceptions to two dynasties, rather than one of their own.
Cleveland could've had an additional four American League pennants in their history had their on-field play matched the on-paper expectations. Napoleon Lajoie wouldn't have gone down in history as one of the best players never to reach the postseason, with two World Series appearances during his time leading the "Naps."
The powerhouse Athletics from 1929-31 would've won only one pennant during that span, but they would've had an additional one in 1928, perhaps giving Ty Cobb a World Series title in his final season.
The National League also sees some teams look more dynastic than reality proved them to be. The Cubs might've potentially won an astounding six pennants in seven years between 1932 and 1938. Those Cubs always came up short in the World Series, but history should remember them much more favorably than it does.
The Brooklyn Dodgers stole the 1947 pennant from their rivals in St. Louis in Jackie Robinson's debut season, but it appears that they, not the Yankees, should've won five straight pennants between 1949 and 1953. While the Red Sox should've captured the 1949 AL flag, we would've had a Yankees-Dodgers matchup four straight seasons to start the 1950s.
And how about those Milwaukee Braves? That immensely talented club should've won four in a row during the 1956-59 seasons, not just the two they did.
The Koufax-era Dodgers also appear to be overrated, winning pennants only in 1955, when he was a benchwarming rookie, and 1966, when he pitched his arm off in his final season. The Cincinnati Reds and San Francisco Giants are the great forgotten teams of the '60s.
One concept that has gained popularity over the years in advanced sports analysis is the concept of Pythagorean Won-Lost Record. For those unfamiliar, Pythagorean Won-Lost Record uses a formula to determine the number of wins and losses a team should be expected to have based on the number of runs scored versus runs allowed. Few teams play precisely to their Pythagorean expectations, but most fall within three games of it. There are always, however, teams that wildly exceed or fall short of their expectations, and in a pennant race, those games can be the difference between a trip to the World Series and an early winter break.
Before the divisional play era, only one team from each league made it to the postseason. Based on Pythagorean W-L, how often did we see the World Series matchup that should've been expected? The chart below shows who won the Pythagorean pennant each year during that era. Teams marked with red are different than the actual winners, and boxes marked with blue are ones where tiebreakers would've had to be played to determine the winner.
| NL | AL | |
|---|---|---|
| 1903 | Pittsburg Pirates (86-54) | Boston Americans (90-48) |
| 1905 | New York Giants (105-48) | Chicago White Sox (97-55) |
| 1906 | Chicago Cubs (115-37) | Cleveland Naps (98-55) |
| 1907 | Chicago Cubs (102-50) | Detroit Tigers (93-57) |
| 1908 | New York Giants (101-53) | Cleveland Naps (92-62) |
| 1909 | Chicago Cubs (109-44) | Philadelphia Athletics (102-51) |
| 1910 | Chicago Cubs (101-53) | Philadelphia Athletics (103-47) |
| 1911 | New York Giants (99-54) | Philadelphia Athletics (99-52) |
| 1912 | New York Giants (100-51) | Boston Red Sox (102-50) |
| 1913 | New York Giants (95-57) | Philadelphia Athletics (97-56) |
| 1914 | Boston Braves (89-64) | Philadelphia Athletics (99-53) |
| 1915 | Philadelphia Phillies (92-60) | Chicago White Sox (100-54) |
| 1916 | Brooklyn Robins (92-62) | Chicago White Sox (90-64) |
| 1917 | New York Giants (100-54) | Chicago White Sox (101-53) |
| 1918 | Chicago Cubs (83-46) | Boston Red Sox (76-50) |
| 1919 | Cincinnati Reds (92-48) | Chicago White Sox (84-56) |
| 1920 | Brooklyn Robins/New York Giants (93-61) | Cleveland Indians/New York Yankees (97-57) |
| 1921 | New York Giants (95-58) | New York Yankees (96-57) |
| 1922 | New York Giants (95-59) | St. Louis Browns (98-56) |
| 1923 | New York Giants (92-61) | New York Yankees (95-57) |
| 1924 | New York Giants (96-57) | Washington Senators (92-62) |
| 1925 | Pittsburgh Pirates (93-60) | Washington Senators (90-61) |
| 1926 | St. Louis Cardinals (90-64) | Cleveland Indians (90-64) |
| 1927 | Pittsburgh Pirates (92-62) | New York Yankees (109-45) |
| 1928 | St. Louis Cardinals (94-60) | Philadelphia Athletics (97-56) |
| 1929 | Chicago Cubs (94-58) | Philadelphia Athletics (100-50) |
| 1930 | St. Louis Cardinals (94-60) | Washington Senators (95-59) |
| 1931 | St. Louis Cardinals (97-57) | New York Yankees (100-53) |
| 1932 | Chicago Cubs (86-68) | New York Yankees (99-55) |
| 1933 | Chicago Cubs/New York Giants | Washington Senators (93-59) |
| 1934 | New York Giants (95-58) | Detroit Tigers (98-56) |
| 1935 | Chicago Cubs (101-53) | Detroit Tigers (97-54) |
| 1936 | Chicago Cubs (93-61) | New York Yankees (102-51) |
| 1937 | Chicago Cubs/New York Giants | New York Yankees (103-51) |
| 1938 | Chicago Cubs (88-64) | New York Yankees (97-55) |
| 1939 | Cincinnati Reds (95-59) | New York Yankees (111-40) |
| 1940 | Cincinnati Reds (96-57) | Detroit Tigers (92-62) |
| 1941 | Brooklyn Dodgers (99-55) | New York Yankees (96-58) |
| 1942 | St. Louis Cardinals (107-47) | New York Yankees (107-47) |
| 1943 | St. Louis Cardinals (101-53) | New York Yankees (92-62) |
| 1944 | St. Louis Cardinals (107-47) | St. Louis Browns (88-66) |
| 1945 | Chicago Cubs (99-55) | NYY/DET/WSH/SLB |
| 1946 | St. Louis Cardinals (97-59) | Boston Red Sox (97-57) |
| 1947 | St. Louis Cardinals (91-63) | New York Yankees (100-54) |
| 1948 | Boston Braves (93-60) | Cleveland Indians (104-51) |
| 1949 | Brooklyn Dodgers (98-56) | Boston Red Sox (97-57) |
| 1950 | Brooklyn Dodgers (88-66) | New York Yankees (96-58) |
| 1951 | Brooklyn Dodgers (96-61) | New York Yankees (94-60) |
| 1952 | Brooklyn Dodgers (94-59) | New York Yankees (95-59) |
| 1953 | Brooklyn Dodgers (99-55) | New York Yankees (101-50) |
| 1954 | New York Giants (97-57) | Cleveland Indians (104-50) |
| 1955 | Brooklyn Dodgers (95-58) | New York Yankees (97-57) |
| 1956 | Milwaukee Braves (92-62) | New York Yankees (98-56) |
| 1957 | Milwaukee Braves (93-61) | New York Yankees (98-56) |
| 1958 | Milwaukee Braves (92-62) | New York Yankees (96-58) |
| 1959 | Milwaukee Braves (89-67) | Cleveland Indians (87-67) |
| 1960 | Pittsburgh Pirates (92-62) | Chicago White Sox (90-64) |
| 1961 | San Francisco Giants (89-65) | New York Yankees (103-59) |
| 1962 | San Francisco Giants (100-65) | New York Yankees (94-68) |
| 1963 | St. Louis Cardinals (94-68) | New York Yankees (100-61) |
| 1964 | Cincinnati Reds (92-70) | Chicago White Sox (99-63) |
| 1965 | Cincinnati Reds (93-69) | Minnesota Twins (100-62) |
| 1966 | Los Angeles Dodgers (97-65) | Baltimore Orioles (96-64) |
| 1967 | St. Louis Cardinals (97-64) | Boston Red Sox (93-69) |
| 1968 | St. Louis Cardinals (96-66) | Detroit Tigers (103-59) |
It's heartening to see that most years the "correct" team wins.There are some long stretches here of black ink.
It's interesting to note that based on this data, several historical teams could be considered overrated or underrated. Connie Mack's Athletics from the "$100,000 Infield" era should've won five of six pennants, rather than the mere four of five they actually won. Their American League successors should've been the Chicago White Sox, if only they hadn't underperformed. The Red Sox of that era would've been the exceptions to two dynasties, rather than one of their own.
Cleveland could've had an additional four American League pennants in their history had their on-field play matched the on-paper expectations. Napoleon Lajoie wouldn't have gone down in history as one of the best players never to reach the postseason, with two World Series appearances during his time leading the "Naps."
The powerhouse Athletics from 1929-31 would've won only one pennant during that span, but they would've had an additional one in 1928, perhaps giving Ty Cobb a World Series title in his final season.
The National League also sees some teams look more dynastic than reality proved them to be. The Cubs might've potentially won an astounding six pennants in seven years between 1932 and 1938. Those Cubs always came up short in the World Series, but history should remember them much more favorably than it does.
The Brooklyn Dodgers stole the 1947 pennant from their rivals in St. Louis in Jackie Robinson's debut season, but it appears that they, not the Yankees, should've won five straight pennants between 1949 and 1953. While the Red Sox should've captured the 1949 AL flag, we would've had a Yankees-Dodgers matchup four straight seasons to start the 1950s.
And how about those Milwaukee Braves? That immensely talented club should've won four in a row during the 1956-59 seasons, not just the two they did.
The Koufax-era Dodgers also appear to be overrated, winning pennants only in 1955, when he was a benchwarming rookie, and 1966, when he pitched his arm off in his final season. The Cincinnati Reds and San Francisco Giants are the great forgotten teams of the '60s.
Labels:
lists
Tuesday, April 17, 2018
Interregnum Players
Not every player gets to be a part of the championship teams. Some lucky (or unlucky) few do, however, get to join the roster in the aftermath of a championship and skip out just before the next one. In so doing, they become icons of the years in between.
The term I have coined for such a man is an "Interregnum Player." What are the exact criteria?
1. He must not have played for the franchise in question the season they won a World Series (though I do make a slight exception for one player).
2. He must have played for the franchise in question in at least 80% of the seasons between two championships. The Eighty-Percenters are marked with an asterisk below.
Here's the full list, in alphabetical order:
Some of you are now rightfully pointing out that Don Sutton rejoined the Dodgers for the 1988 season, when they won the World Series, so he technically shouldn't qualify for this list based on the original criteria. However, I decided to make an exception for him, because A. there was a significant gap between his rejoining the Dodgers and his original stint, B. he was released before the end of the 1988 season and didn't get to participate in the World Series, and C. how often do you get a chance to include a guy who fits a 15-year championship gap so precisely? He had to be in here. He might be the most perfect example of the Interregnum Player if not for that technicality.
The term I have coined for such a man is an "Interregnum Player." What are the exact criteria?
1. He must not have played for the franchise in question the season they won a World Series (though I do make a slight exception for one player).
2. He must have played for the franchise in question in at least 80% of the seasons between two championships. The Eighty-Percenters are marked with an asterisk below.
Here's the full list, in alphabetical order:
| Name | Years With Team |
|---|---|
| Mike Adamson | 1967-1969 BAL |
| Doug Baker | 1988-1990 MIN |
| Dave Berg* | 1998-2001 FLA |
| Michael Bowden | 2008-2012 BOS |
| Greg Brock* | 1982-1986 LAD |
| Gino Cimoli | 1956-1958 BRO/LAD |
| Donn Clendenon* | 1961-1968 PIT |
| Wilbur Cooper* | 1912-1924 PIT |
| Vic Darensbourg | 1998-2002 FLA |
| Ryan Dempster | 1998-2002 FLA |
| Larry Doyle* | 1907-16, 1918-1920 NYG |
| Bill Drescher | 1944-1946 NYY |
| Jim Dwyer | 1988-1990 MIN |
| Art Fletcher* | 1909-1920 NYG |
| Fred Frankhouse | 1927-1930 STL |
| Jason Giambi* | 2002-2008 NYY |
| Rick Honeycutt* | 1983-1987 LAD |
| Randy Jackson | 1956-1958 BRO/LAD |
| Freddie Lindstrom* | 1924-1932 NYG |
| Jed Lowrie* | 2008-2011 BOS |
| Ryan Ludwick | 2007-2010 STL |
| Don Mattingly* | 1982-1995 NYY |
| Al McBean* | 1961-68, 1970 PIT |
| Bill McGee | 1935-1941 STL |
| Kevin Millar | 1998-2002 FLA |
| Johnny Mize* | 1936-1941 STL |
| John Moses | 1988-1990 MIN |
| Manny Mota* | 1969-1980 LAD |
| Mike Mussina | 2001-2008 NYY |
| Steve Roser | 1944-1946 NYY |
| Brendan Ryan | 2007-2010 STL |
| Jesus Sanchez* | 1998-2001 FLA |
| Roy Sherid | 1929-1931 NYY |
| Ted Simmons* | 1968-1980 STL |
| Mario Soto* | 1977-1988 CIN |
| Don Sutton | 1966-1980 LAD |
| Russ Van Atta | 1933-1935 NYY |
| Preston Wilson | 1998-2002 FLA |
Some of you are now rightfully pointing out that Don Sutton rejoined the Dodgers for the 1988 season, when they won the World Series, so he technically shouldn't qualify for this list based on the original criteria. However, I decided to make an exception for him, because A. there was a significant gap between his rejoining the Dodgers and his original stint, B. he was released before the end of the 1988 season and didn't get to participate in the World Series, and C. how often do you get a chance to include a guy who fits a 15-year championship gap so precisely? He had to be in here. He might be the most perfect example of the Interregnum Player if not for that technicality.
Labels:
lists
Subscribe to:
Posts (Atom)